Life Insurance Statistics Canada 2024 | Samos
Find out how many Canadians have life insurance, what kind, and why. These 2024 life insurance statistics reveal local attitudes to this type of cover.
Find out how many Canadians have life insurance, what kind, and why. These 2024 life insurance statistics reveal local attitudes to this type of cover.


Canada is ranked 8th globally for the value of life and non-life direct premiums written, and in 2024, the average spend in this market is expected to reach $850 per capita.
To find out more about Canada’s stance on life insurance, we surveyed 981,619 people in the country on various social media platforms. We reviewed data for a full year, ending on October 14th, 2024, and these are the results of our findings.
INDEX
Nearly 90% of respondents have life insurance
Considerations, coverage needs, quotes and policies causing a lack of cover
More than 70% of respondents agree high costs prevent them from having life insurance
Canadians say car insurance is the most important cover
Over a quarter of respondents chose life insurance as an investment
Over a third of respondents purchased life insurance from an agent
Whole life insurance the most commonly purchased type of life insurance
Just under 50% of Canadians surveyed insured for $100,000
48.5% agree their life insurance is worth it
38.5% of respondents say they have expert level knowledge of life insurance
Over 65s most engaged on the topic of life insurance
21% more women insured than men
Ontario the most insured province
Under $40,000 earners account for over 80% of those with life insurance
About the data
Do You Have Life Insurance?
Nearly 90% of respondents have life insurance
Canadians clearly prioritize life insurance, with the graph below showing what percentage of those surveyed have and don’t have this type of coverage.
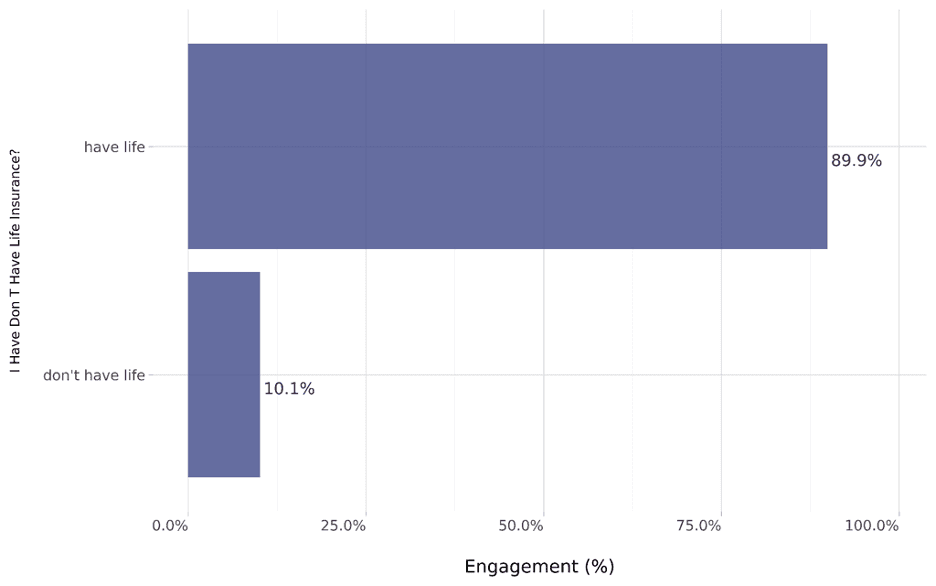
Of the 981,619 people surveyed, the vast majority have life insurance (89.9%), with only 10.1% saying they do not have coverage. This differs somewhat from the results of a Life Insurance and Marketing Research Association's (LIMRA) study on an undisclosed number of participants that found that only 57% of Canadian adults have life insurance. However, this figure was an improvement on a similar study conducted in 2019, as it had increased by 3 points, showing that this type of cover is on the rise.
Why Don’t You Have Life Insurance?
Considerations, coverage needs, quotes and policies causing a lack of cover
Despite life insurance offering financial stability in the event of a death, here’s what’s stopping Canadians from taking out cover.

While some studies show that 80% of consumers overestimate the cost of life insurance and many say that they are uncomfortable talking about death, the main reasons we found for Canadians not having life insurance focused more on the fact that there was a lack of urgency or understanding about the topic.
Topping engagement levels at 41.1% were respondents citing the fact that they were considering getting life insurance, followed by 33.9% who were evaluating coverage needs. Less than half of those evaluating coverage were looking for quotes (13.3%), while 11.7% didn’t have life insurance as they didn’t understand the policy.
Why Have You Chosen Not To Buy Life Insurance?
More than 70% of respondents agree high costs prevent them from having life insurance
Costs are the barrier to entry for most Canadians, while complexity is the least likely reason for not having life insurance. Let’s unpack what the graph below reveals:
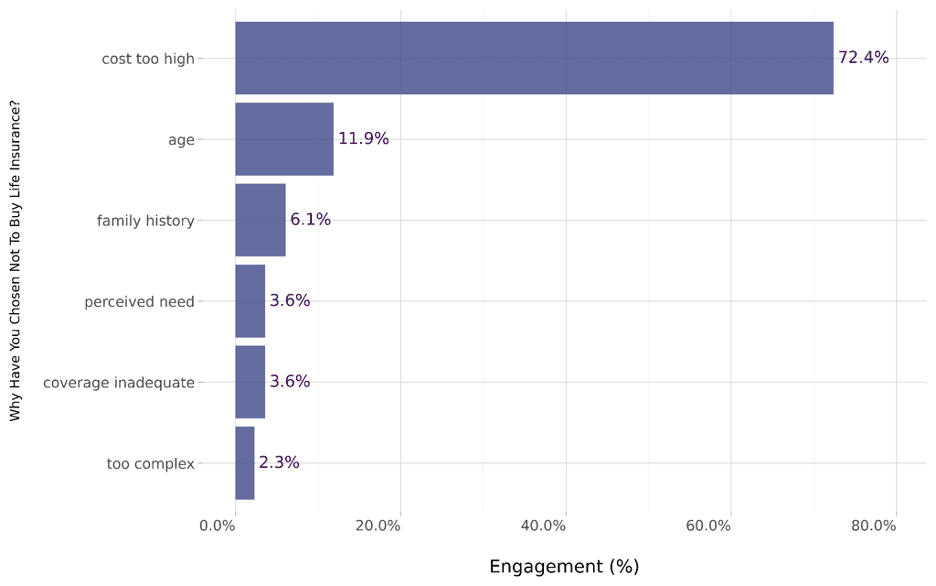
With 72.4% engagement levels, the overriding reason Canadians in our surveyed data chose not to take out life insurance was due to it being too expensive. This correlates with reports that state Canadians are underinsured due to financial concerns, with 53% saying they haven’t purchased coverage they know they need due to it being too expensive and 33% stating that they have other financial priorities.
With costs making up the majority, age is only a deterring factor for 11.9%, while family history garners just 6.1% engagement. A perceived need scores a paltry 3.6%, tying with coverage being inadequate. Lastly, we see a lack of education and understanding on the topic again, with 2.3% of respondents citing life insurance being too complex, so they have foregone it.
Which Type Of Insurance Is Most Important To You?
Canadians say car insurance is the most important cover
With car insurance being the most important and long-term care the least, we’ve taken a closer look at what the statistics say about Canadian’s insurance priorities.

Canadian engagement levels for auto insurance are the highest at 24.6% are likely to be driven by the mandatory requirement to have this in place in order to operate a motor vehicle. This is followed by homeowners insurance at 16.8%, making assets the most insured overall. In third place was life insurance at 14.8%, followed closely by health insurance at 14.6%. This is interesting, as Statista notes that health insurance is the most common insurance type in Canada in 2024, with 79% of respondents holding this type of coverage.
Pet insurance also ranks as a priority, with engagement levels of 12.3%, before dropping to 5.6% for travel insurance, 4.7% for renters insurance, and 3.7% for liability insurance. Disability insurance didn’t rank as very important, at just 1.9%, while long-term care insurance only scored 0.9% engagement. Considering the high cost of care in Canada, this is somewhat surprising, but as the government offers care programs and assistance, this may be why these insurance types get such low engagement.
What Made You Decide To Get Life Insurance?
Over a quarter chose life insurance as an investment
There are several reasons for choosing to get life insurance, and we’ve taken a closer look at what our Canadian respondents cite as their deciding factors.

22 million Canadians own $5.5 trillion in life insurance coverage, so it’s not unexpected that our data recorded the highest engagement rates (26.3%) for investment being a deciding factor. Peace of mind was a good motivator, too, at 18.5%, followed by family protection, just 0.3% behind at 18.2%.
Financial security came in as the fourth most pressing reason at 12.4%, followed by savings at 9.9%. Tax benefits (8.1%) and debt coverage (5.1%) were minor deciding factors, while funeral expenses only accounted for 1.6% deciding to take out this type of coverage.
How Did You Buy Your Life Insurance Policy?
Over a third of respondents purchased life insurance from an agent
Our graph reveals who life insurance was purchased from and which were the most popular options. Find out more below:
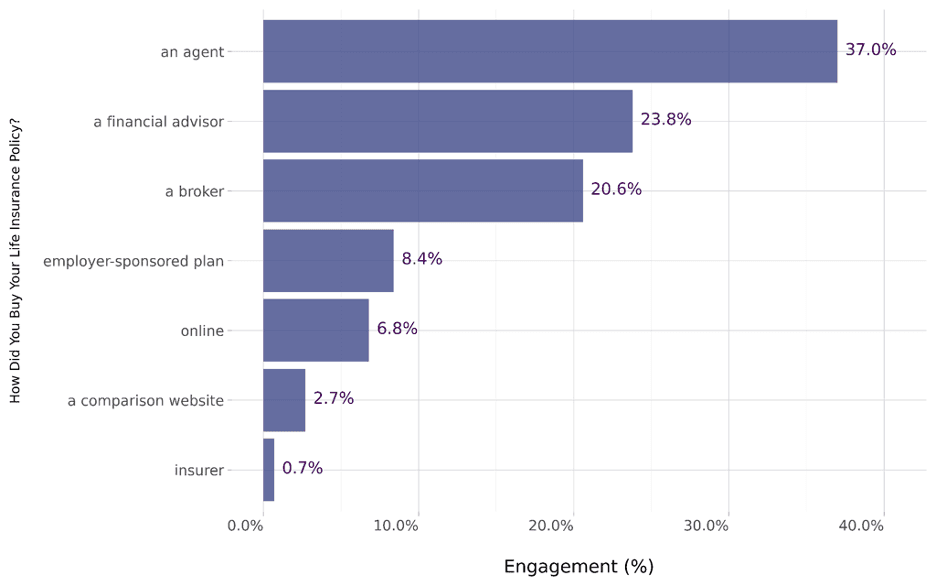
According to our results, an agent is the most common way to buy life insurance in Canada, with 37% engagement levels. As there are 22,611 Insurance Brokers and Agencies businesses operating in the country, agents are readily available. A financial advisor was the second most common option, with 23.8% citing these professionals as the person who sold them their cover, followed by brokers at 20.6%. What is also interesting to note is the actual nomenclature used by respondents in identifying their channel of purchase amongst “agent”, “broker”, “financial advisor”.
Employer-sponsored plans were responsible for 8.7% of those surveyed purchasing life insurance policies, and 6.8% made the purchase online. A comparison website drew 2.7% engagement, and an insurer came in last at only 0.7%.
What Kind Of Life Insurance Have You Bought?
Whole life insurance the most commonly purchased type of life insurance
The data we collected shows what type of life insurance Canadians most commonly bought, with the results explained below.
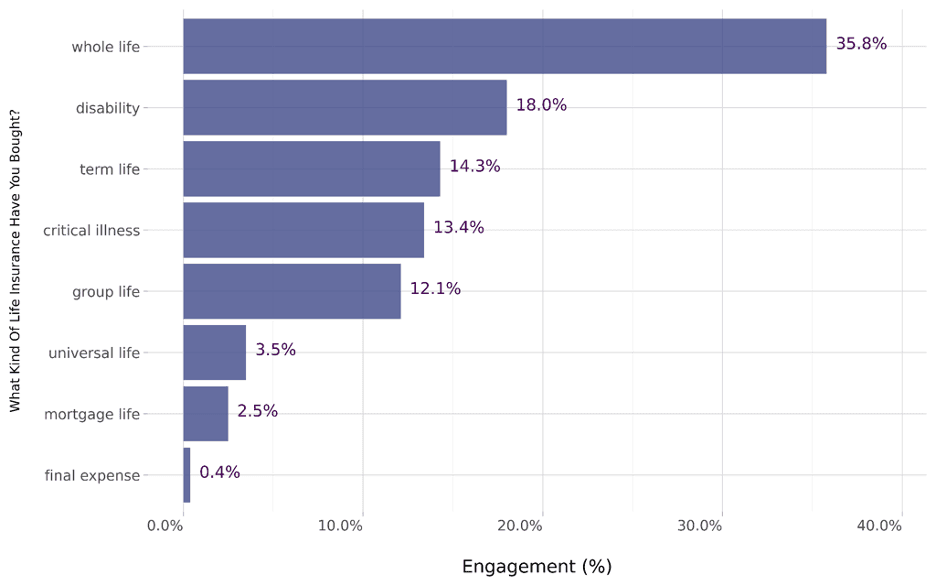
At 35.8% engagement, whole life insurance is the type of life insurance that the most respondents in our survey have purchased. This insurance pays a benefit upon the death of the insured based on premiums and savings. 18% of 981,619 Canadians surveyed have bought disability insurance, 14.3% term life, and 13.4% critical illness cover.
Group life insurance has been purchased by 12.1% of respondents, while universal life by only 3.5% and mortgage life by 2.5%. Just 0.4% have purchased final expense insurance, making this the least common type overall.
How Much Does Your Life Insurance Policy Cover You For?
Just under 50% of Canadians surveyed insured for $100,000
Canadians' lives are insured for between $1 million and $100,000. We’ve unpacked the value of cover for those surveyed:

Of those surveyed, the majority of those insured (47.1%) have cover worth $100,000. In contrast, only 12.1% have cover for a million dollars. The second highest engagement rate was for those with cover of $500,000 (27.1%), while those with $250,000 cover came in third at 13.8%.
With the higher amounts scoring the lower engagement levels it’s understandable that 2.4 million people in Canada say they are underinsured, rather than over.
How Much Value For Money Is Your Life Insurance?
48.5% agree their life insurance is worth it
The majority of those surveyed agree that their life insurance is worth it or good value. Here’s how the numbers stacked up:
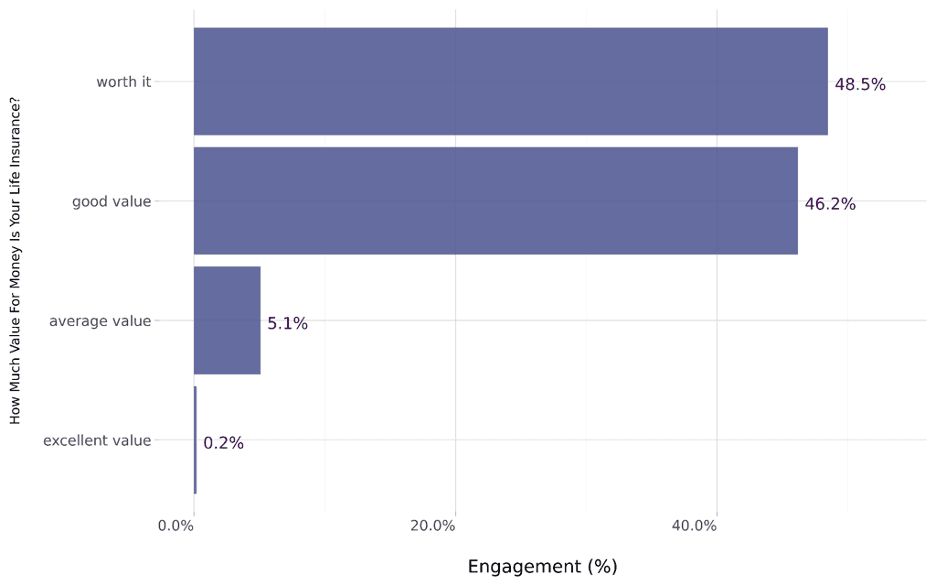
Considering Canada's life and health insurers paid out a record $128 billion in benefit claims in 2023, it’s positive to see that 48.5% of respondents agree their life insurance is worth it, and 46.2% say it’s good value, leaving no doubt that those insured see the value in their premiums.
Just 5.1% say they feel their insurance has average value, while 0.2% say it has excellent value.
How Would You Describe Your Knowledge Level On Life Insurance?
38.5% of respondents say they have expert level knowledge of life insurance
The surveyed results revealed interesting opinions on the level of expertise Canadians have when it comes to life insurance. Let’s explore the findings below:

Despite understanding policies and complexity being barriers to entry for some Canadians, the largest number of those surveyed (38.5%) rate their life insurance knowledge level as expert. This was followed by 25.2% engagement levels for “advanced”.
Those with beginner knowledge achieved 17.7% engagement, while no knowledge and intermediate tied at 9.3% each.
Canadian Life Insurance Demographics
Over 65s most engaged on the topic of life insurance
This graph shows which age groups are the most engaged on the topic of life insurance. We’ve dug deeper into who has life insurance and who doesn’t.

With life expectancy on the rise in Canada and the current average of 83.11 years, it’s easy to see why those over the age of 65 years old have the highest engagement levels at 28.9%. From here, the age groups decline in this order:
Ages 55-64: 21%
Ages 45-54: 18.6%
Ages 35-44: 13.1%
However, those under 25 years old score higher at 9.8% than those in the 25-34 age group (8.6%) showing that the youngest demographic is better insured in this regard than their up-to-a-decade older peers.
21% more women insured than men
Based on our findings, over half of women surveyed have life insurance, with men more than 20% behind:

In Canada, those who identify as female are seemingly better insured than men. Our data recorded 60.5% of engagement from females with life insurance, while only 39.5% was from males. This is interesting when compared to the number of breadwinners in Canada, as men dominate this sector, despite there being an increase of 7% in female breadwinners from 23% in 1996 to now nearly 30%.
Ontario the most insured Province
With nearly 40% of respondents in Ontario, this graph illustrates where our 981,619 respondents reside:
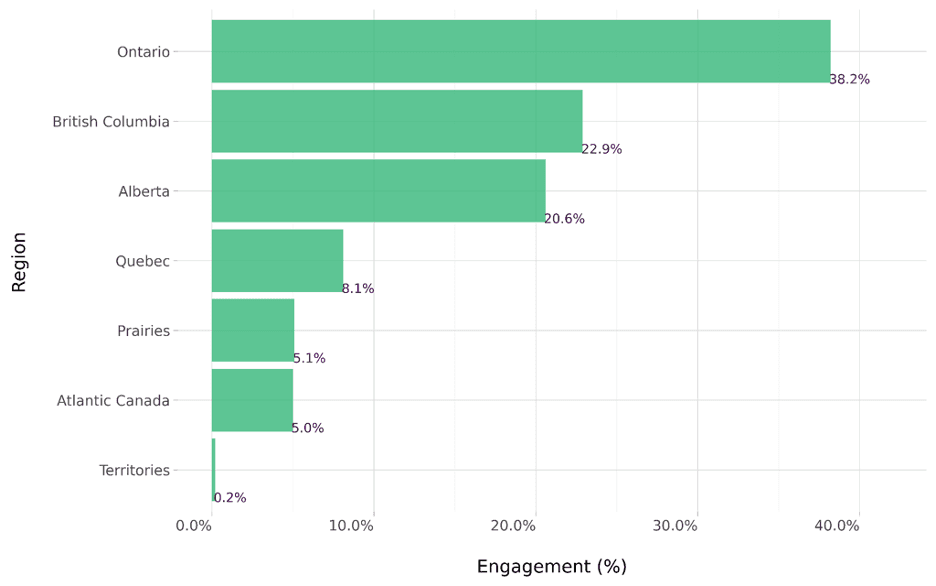
At 38.2%, Ontario is the most insured province, followed by British Columbia at 22.9%. This correlates with other findings that recorded a 15.5% increase in average coverage between 2018 and 2022 in Ontario and a 14.4% increase in British Columbia.
Alberta is in third place with 20.6% engagement before Quebec comes in fourth at a reduced 8.1%. The Prairies get 5.1% engagement, while Atlantic Canada is hot on their heels with 5%. TheTerritories have the least insured people, at just 0.2%, which is perhaps expected due to their sparse population numbers.
Those earning under $40,000 make up over 80% of those with life insurance
The graph below indicates which income brackets respondents who have life insurance fall into, with some interesting results:

What really stands out here is that the majority of respondents who have life insurance (84.6%) earn the least. In fact, they earn lower than the average Canadian salary of $54,630.68 a year. In contrast, those earning above the average register minimal engagement, with the statistics lining up as follows:
$120,000 to $200,000: 6.4%
$200,000 to 500,000: 4.1%
$80,000 to $120,000: 2.8%
$40,000 to $$80,000: 1.9%
$500,000 to $1 million: 0.3%
Nearly a quarter of Canadians are concerned that they’ll leave their dependents in difficult financial situations if they were to die prematurely. However, the data we reviewed shows that many people are taking positive steps toward looking after their loved ones, that the overall sentiment toward this type of coverage is positive, and the life insurance market continues to grow.
About the Data
The data used in this survey was sourced from an independent sample of 981,619 people in Canada on X, Quora, Reddit, TikTok and Threads. The responses are collected within a 95% confidence interval and 4% margin of error and engagement estimates how many people in the location are participating. Demographics are determined using many features, including name, location and self-disclosed description. Privacy is preserved using k-anonymity and differential privacy. The results are based on what people describe online — questions were not posed to the people in the sample.
Canada is ranked 8th globally for the value of life and non-life direct premiums written, and in 2024, the average spend in this market is expected to reach $850 per capita.
To find out more about Canada’s stance on life insurance, we surveyed 981,619 people in the country on various social media platforms. We reviewed data for a full year, ending on October 14th, 2024, and these are the results of our findings.
INDEX
Nearly 90% of respondents have life insurance
Considerations, coverage needs, quotes and policies causing a lack of cover
More than 70% of respondents agree high costs prevent them from having life insurance
Canadians say car insurance is the most important cover
Over a quarter of respondents chose life insurance as an investment
Over a third of respondents purchased life insurance from an agent
Whole life insurance the most commonly purchased type of life insurance
Just under 50% of Canadians surveyed insured for $100,000
48.5% agree their life insurance is worth it
38.5% of respondents say they have expert level knowledge of life insurance
Over 65s most engaged on the topic of life insurance
21% more women insured than men
Ontario the most insured province
Under $40,000 earners account for over 80% of those with life insurance
About the data
Do You Have Life Insurance?
Nearly 90% of respondents have life insurance
Canadians clearly prioritize life insurance, with the graph below showing what percentage of those surveyed have and don’t have this type of coverage.

Of the 981,619 people surveyed, the vast majority have life insurance (89.9%), with only 10.1% saying they do not have coverage. This differs somewhat from the results of a Life Insurance and Marketing Research Association's (LIMRA) study on an undisclosed number of participants that found that only 57% of Canadian adults have life insurance. However, this figure was an improvement on a similar study conducted in 2019, as it had increased by 3 points, showing that this type of cover is on the rise.
Why Don’t You Have Life Insurance?
Considerations, coverage needs, quotes and policies causing a lack of cover
Despite life insurance offering financial stability in the event of a death, here’s what’s stopping Canadians from taking out cover.

While some studies show that 80% of consumers overestimate the cost of life insurance and many say that they are uncomfortable talking about death, the main reasons we found for Canadians not having life insurance focused more on the fact that there was a lack of urgency or understanding about the topic.
Topping engagement levels at 41.1% were respondents citing the fact that they were considering getting life insurance, followed by 33.9% who were evaluating coverage needs. Less than half of those evaluating coverage were looking for quotes (13.3%), while 11.7% didn’t have life insurance as they didn’t understand the policy.
Why Have You Chosen Not To Buy Life Insurance?
More than 70% of respondents agree high costs prevent them from having life insurance
Costs are the barrier to entry for most Canadians, while complexity is the least likely reason for not having life insurance. Let’s unpack what the graph below reveals:

With 72.4% engagement levels, the overriding reason Canadians in our surveyed data chose not to take out life insurance was due to it being too expensive. This correlates with reports that state Canadians are underinsured due to financial concerns, with 53% saying they haven’t purchased coverage they know they need due to it being too expensive and 33% stating that they have other financial priorities.
With costs making up the majority, age is only a deterring factor for 11.9%, while family history garners just 6.1% engagement. A perceived need scores a paltry 3.6%, tying with coverage being inadequate. Lastly, we see a lack of education and understanding on the topic again, with 2.3% of respondents citing life insurance being too complex, so they have foregone it.
Which Type Of Insurance Is Most Important To You?
Canadians say car insurance is the most important cover
With car insurance being the most important and long-term care the least, we’ve taken a closer look at what the statistics say about Canadian’s insurance priorities.

Canadian engagement levels for auto insurance are the highest at 24.6% are likely to be driven by the mandatory requirement to have this in place in order to operate a motor vehicle. This is followed by homeowners insurance at 16.8%, making assets the most insured overall. In third place was life insurance at 14.8%, followed closely by health insurance at 14.6%. This is interesting, as Statista notes that health insurance is the most common insurance type in Canada in 2024, with 79% of respondents holding this type of coverage.
Pet insurance also ranks as a priority, with engagement levels of 12.3%, before dropping to 5.6% for travel insurance, 4.7% for renters insurance, and 3.7% for liability insurance. Disability insurance didn’t rank as very important, at just 1.9%, while long-term care insurance only scored 0.9% engagement. Considering the high cost of care in Canada, this is somewhat surprising, but as the government offers care programs and assistance, this may be why these insurance types get such low engagement.
What Made You Decide To Get Life Insurance?
Over a quarter chose life insurance as an investment
There are several reasons for choosing to get life insurance, and we’ve taken a closer look at what our Canadian respondents cite as their deciding factors.

22 million Canadians own $5.5 trillion in life insurance coverage, so it’s not unexpected that our data recorded the highest engagement rates (26.3%) for investment being a deciding factor. Peace of mind was a good motivator, too, at 18.5%, followed by family protection, just 0.3% behind at 18.2%.
Financial security came in as the fourth most pressing reason at 12.4%, followed by savings at 9.9%. Tax benefits (8.1%) and debt coverage (5.1%) were minor deciding factors, while funeral expenses only accounted for 1.6% deciding to take out this type of coverage.
How Did You Buy Your Life Insurance Policy?
Over a third of respondents purchased life insurance from an agent
Our graph reveals who life insurance was purchased from and which were the most popular options. Find out more below:

According to our results, an agent is the most common way to buy life insurance in Canada, with 37% engagement levels. As there are 22,611 Insurance Brokers and Agencies businesses operating in the country, agents are readily available. A financial advisor was the second most common option, with 23.8% citing these professionals as the person who sold them their cover, followed by brokers at 20.6%. What is also interesting to note is the actual nomenclature used by respondents in identifying their channel of purchase amongst “agent”, “broker”, “financial advisor”.
Employer-sponsored plans were responsible for 8.7% of those surveyed purchasing life insurance policies, and 6.8% made the purchase online. A comparison website drew 2.7% engagement, and an insurer came in last at only 0.7%.
What Kind Of Life Insurance Have You Bought?
Whole life insurance the most commonly purchased type of life insurance
The data we collected shows what type of life insurance Canadians most commonly bought, with the results explained below.

At 35.8% engagement, whole life insurance is the type of life insurance that the most respondents in our survey have purchased. This insurance pays a benefit upon the death of the insured based on premiums and savings. 18% of 981,619 Canadians surveyed have bought disability insurance, 14.3% term life, and 13.4% critical illness cover.
Group life insurance has been purchased by 12.1% of respondents, while universal life by only 3.5% and mortgage life by 2.5%. Just 0.4% have purchased final expense insurance, making this the least common type overall.
How Much Does Your Life Insurance Policy Cover You For?
Just under 50% of Canadians surveyed insured for $100,000
Canadians' lives are insured for between $1 million and $100,000. We’ve unpacked the value of cover for those surveyed:

Of those surveyed, the majority of those insured (47.1%) have cover worth $100,000. In contrast, only 12.1% have cover for a million dollars. The second highest engagement rate was for those with cover of $500,000 (27.1%), while those with $250,000 cover came in third at 13.8%.
With the higher amounts scoring the lower engagement levels it’s understandable that 2.4 million people in Canada say they are underinsured, rather than over.
How Much Value For Money Is Your Life Insurance?
48.5% agree their life insurance is worth it
The majority of those surveyed agree that their life insurance is worth it or good value. Here’s how the numbers stacked up:

Considering Canada's life and health insurers paid out a record $128 billion in benefit claims in 2023, it’s positive to see that 48.5% of respondents agree their life insurance is worth it, and 46.2% say it’s good value, leaving no doubt that those insured see the value in their premiums.
Just 5.1% say they feel their insurance has average value, while 0.2% say it has excellent value.
How Would You Describe Your Knowledge Level On Life Insurance?
38.5% of respondents say they have expert level knowledge of life insurance
The surveyed results revealed interesting opinions on the level of expertise Canadians have when it comes to life insurance. Let’s explore the findings below:

Despite understanding policies and complexity being barriers to entry for some Canadians, the largest number of those surveyed (38.5%) rate their life insurance knowledge level as expert. This was followed by 25.2% engagement levels for “advanced”.
Those with beginner knowledge achieved 17.7% engagement, while no knowledge and intermediate tied at 9.3% each.
Canadian Life Insurance Demographics
Over 65s most engaged on the topic of life insurance
This graph shows which age groups are the most engaged on the topic of life insurance. We’ve dug deeper into who has life insurance and who doesn’t.

With life expectancy on the rise in Canada and the current average of 83.11 years, it’s easy to see why those over the age of 65 years old have the highest engagement levels at 28.9%. From here, the age groups decline in this order:
Ages 55-64: 21%
Ages 45-54: 18.6%
Ages 35-44: 13.1%
However, those under 25 years old score higher at 9.8% than those in the 25-34 age group (8.6%) showing that the youngest demographic is better insured in this regard than their up-to-a-decade older peers.
21% more women insured than men
Based on our findings, over half of women surveyed have life insurance, with men more than 20% behind:

In Canada, those who identify as female are seemingly better insured than men. Our data recorded 60.5% of engagement from females with life insurance, while only 39.5% was from males. This is interesting when compared to the number of breadwinners in Canada, as men dominate this sector, despite there being an increase of 7% in female breadwinners from 23% in 1996 to now nearly 30%.
Ontario the most insured Province
With nearly 40% of respondents in Ontario, this graph illustrates where our 981,619 respondents reside:

At 38.2%, Ontario is the most insured province, followed by British Columbia at 22.9%. This correlates with other findings that recorded a 15.5% increase in average coverage between 2018 and 2022 in Ontario and a 14.4% increase in British Columbia.
Alberta is in third place with 20.6% engagement before Quebec comes in fourth at a reduced 8.1%. The Prairies get 5.1% engagement, while Atlantic Canada is hot on their heels with 5%. TheTerritories have the least insured people, at just 0.2%, which is perhaps expected due to their sparse population numbers.
Those earning under $40,000 make up over 80% of those with life insurance
The graph below indicates which income brackets respondents who have life insurance fall into, with some interesting results:

What really stands out here is that the majority of respondents who have life insurance (84.6%) earn the least. In fact, they earn lower than the average Canadian salary of $54,630.68 a year. In contrast, those earning above the average register minimal engagement, with the statistics lining up as follows:
$120,000 to $200,000: 6.4%
$200,000 to 500,000: 4.1%
$80,000 to $120,000: 2.8%
$40,000 to $$80,000: 1.9%
$500,000 to $1 million: 0.3%
Nearly a quarter of Canadians are concerned that they’ll leave their dependents in difficult financial situations if they were to die prematurely. However, the data we reviewed shows that many people are taking positive steps toward looking after their loved ones, that the overall sentiment toward this type of coverage is positive, and the life insurance market continues to grow.
About the Data
The data used in this survey was sourced from an independent sample of 981,619 people in Canada on X, Quora, Reddit, TikTok and Threads. The responses are collected within a 95% confidence interval and 4% margin of error and engagement estimates how many people in the location are participating. Demographics are determined using many features, including name, location and self-disclosed description. Privacy is preserved using k-anonymity and differential privacy. The results are based on what people describe online — questions were not posed to the people in the sample.
Email : hello@samos.com ou
Appeler: 1-866-875-1999
Vos données sont sécurisées avec un chiffrement AES-256 au niveau des blocs de stockage.
©
2024 Assurance Samos (12719410 Canada Inc). Tous droits réservés
Licence FSRA n° 40743M
Email : hello@samos.com ou
Appeler: 1-866-875-1999
Vos données sont sécurisées avec un chiffrement AES-256 au niveau des blocs de stockage.
©
2024 Assurance Samos (12719410 Canada Inc). Tous droits réservés
Licence FSRA n° 40743M
Email : hello@samos.com ou
Appeler: 1-866-875-1999
Vos données sont sécurisées avec un chiffrement AES-256 au niveau des blocs de stockage.
©
2024 Assurance Samos (12719410 Canada Inc). Tous droits réservés
Licence FSRA n° 40743M