Canada is ranked 8th globally for the value of life and non-life direct premiums written.
In 2024, the average spend in this market is expected to reach $850 per capita.
To find out more about Canada's stance on life insurance, we surveyed 981,619 people on various social media platforms.
We reviewed data for a full year, ending on October 14th, 2024, and these are the results of our findings.
Index
- Nearly 90% of respondents have life insurance
- Considerations, coverage needs, quotes and policies causing a lack of cover
- More than 70% of respondents agree high costs prevent them from having life insurance
- Canadians say car insurance is the most important cover
- Over a quarter of respondents chose life insurance as an investment
- Over a third of respondents purchased life insurance from an agent
- Whole life insurance the most commonly purchased type of life insurance
- Just under 50% of Canadians surveyed insured for $100,000
- 48.5% agree their life insurance is worth it
- 38.5% of respondents say they have expert level knowledge of life insurance
- Over 65s most engaged on the topic of life insurance
- 21% more women insured than men
- Ontario the most insured province
- Under $40,000 earners account for over 80% of those with life insurance
About the Data
Do You Have Life Insurance?
Nearly 90% of respondents have life insurance.
Canadians clearly prioritize life insurance, with the graph below showing what percentage of those surveyed have and don't have this type of coverage.
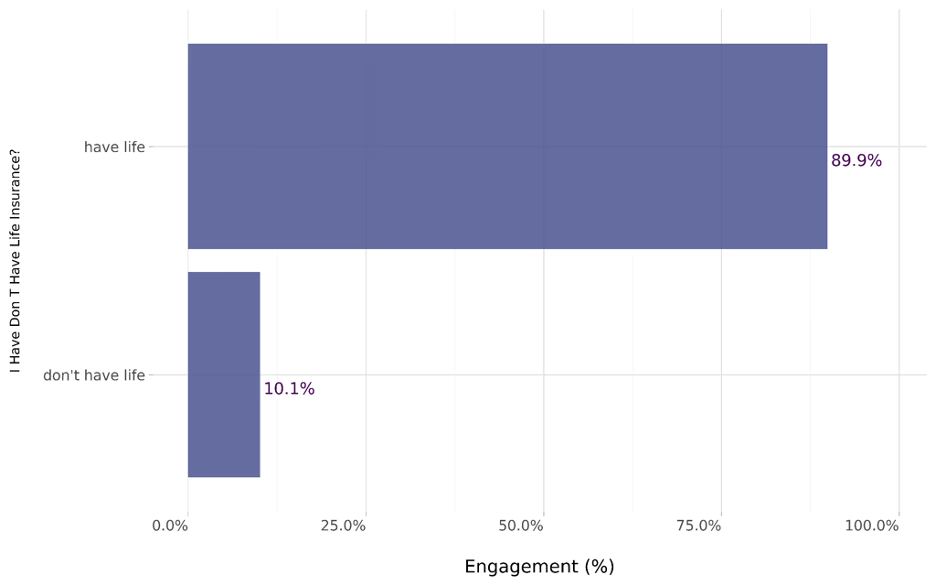 Figure 1: Answers to "Do you have life insurance?"
Of the 981,619 people surveyed, the vast majority have life insurance (89.9%), with only 10.1% saying they do not have coverage.
This differs somewhat from a LIMRA study that found only 57% of Canadian adults have life insurance - an improvement of 3 points since 2019, showing this type of cover is on the rise.
Why Don't You Have Life Insurance?
Despite life insurance offering financial stability in the event of death, lack of urgency or understanding is a primary barrier.
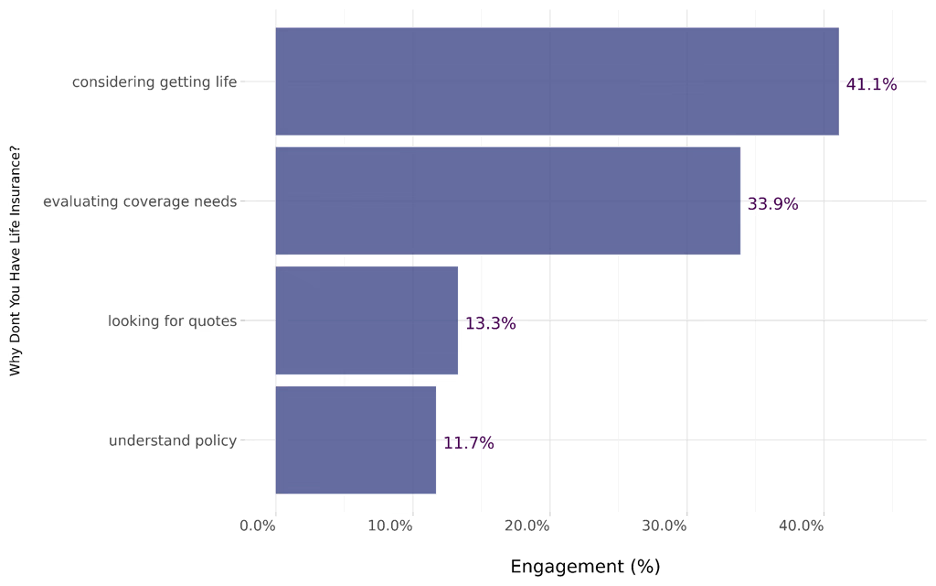 Figure 2: Answers to "Why don't you have life insurance?"
- 41.1% were considering getting life insurance
- 33.9% were evaluating coverage needs
- 13.3% were looking for quotes
- 11.7% didn't understand the policy
Why Have You Chosen Not to Buy Life Insurance?
More than 70% of respondents agree high costs prevent them from having life insurance.
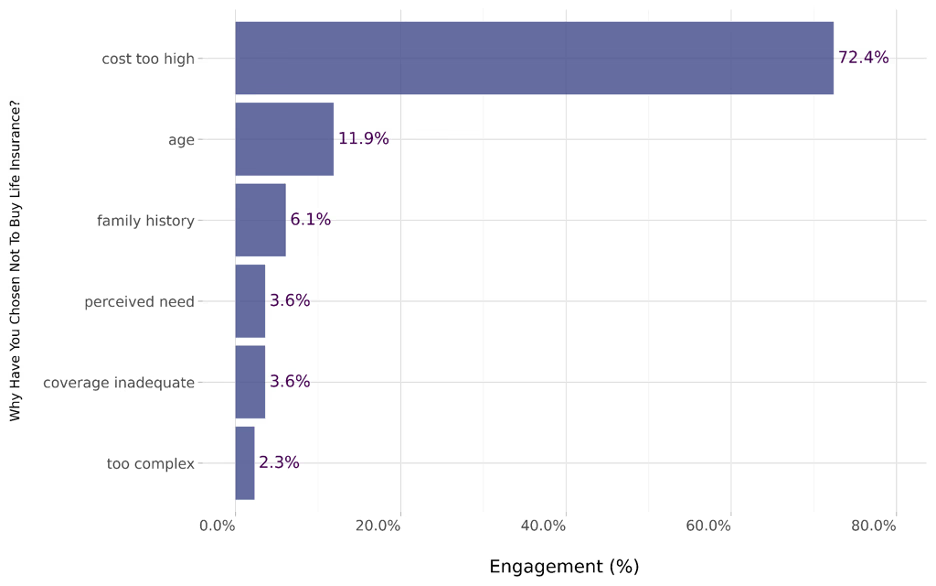 Figure 3: Reasons for not buying life insurance
- 72.4%: Too expensive
- 11.9%: Age
- 6.1%: Family history
- 3.6%: Perceived lack of need
- 2.3%: Too complex
This aligns with other reports that say 53% of Canadians haven't purchased needed coverage due to cost, and 33% have other financial priorities.
Which Type of Insurance Is Most Important to You?
Canadians say car insurance is the most important cover.
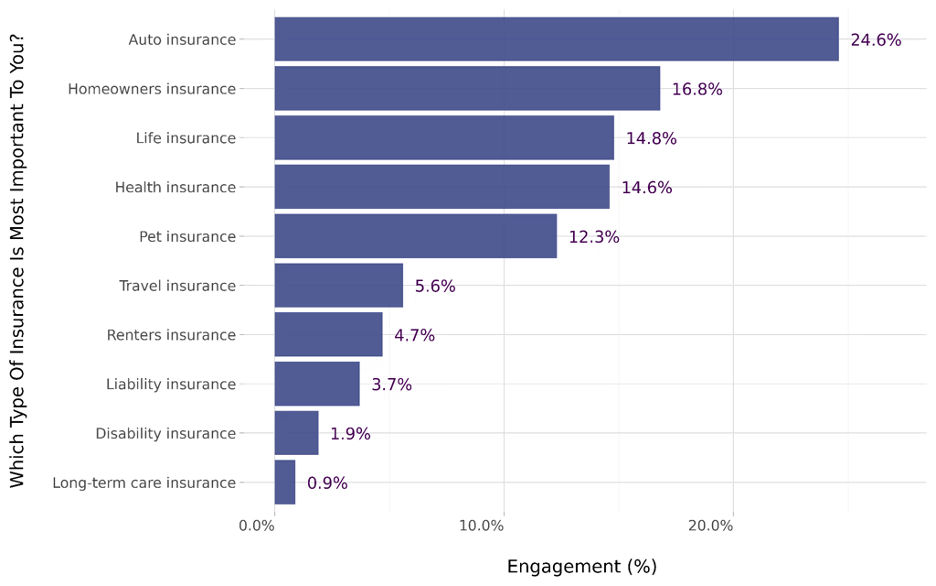 Figure 4: Most important insurance types for Canadians
- 24.6% - Auto insurance (mandatory)
- 16.8% - Homeowners
- 14.8% - Life insurance
- 14.6% - Health insurance
- 12.3% - Pet insurance
- 5.6% - Travel insurance
- 4.7% - Renters insurance
- 3.7% - Liability
- 1.9% - Disability
- 0.9% - Long-term care insurance
What Made You Decide to Get Life Insurance?
Over a quarter chose life insurance as an investment.
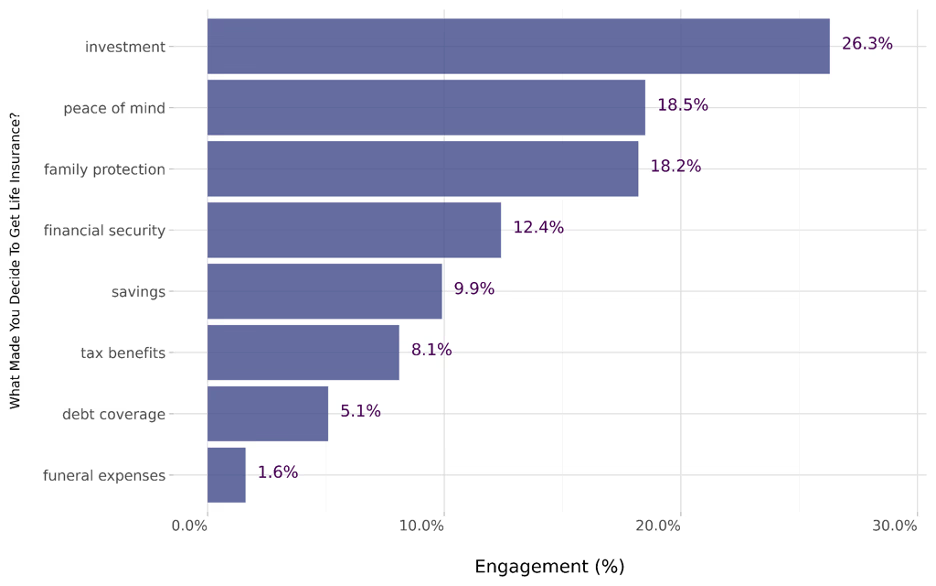 Figure 5: What made you decide to get life insurance
- 26.3% - Investment
- 18.5% - Peace of mind
- 18.2% - Family protection
- 12.4% - Financial security
- 9.9% - Savings
- 8.1% - Tax benefits
- 5.1% - Debt coverage
- 1.6% - Funeral expenses
How Did You Buy Your Life Insurance Policy?
Over a third of respondents purchased life insurance from an agent.
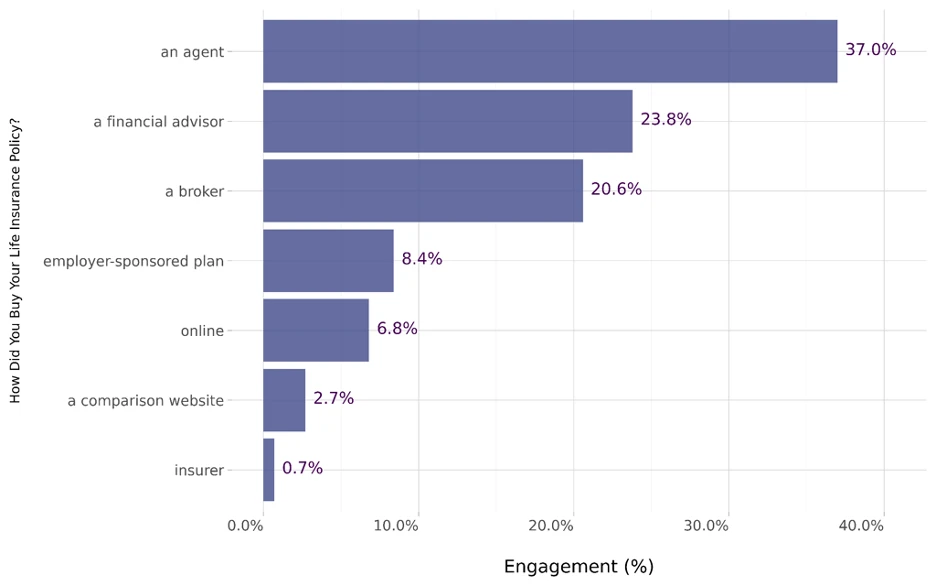 Figure 6: How did you buy your life insurance policy
- 37.0% - Agent
- 23.8% - Financial advisor
- 20.6% - Broker
- 8.7% - Employer-sponsored
- 6.8% - Online
- 2.7% - Comparison website
- 0.7% - Insurer directly
What Kind of Life Insurance Have You Bought?
Whole life insurance is the most commonly purchased.
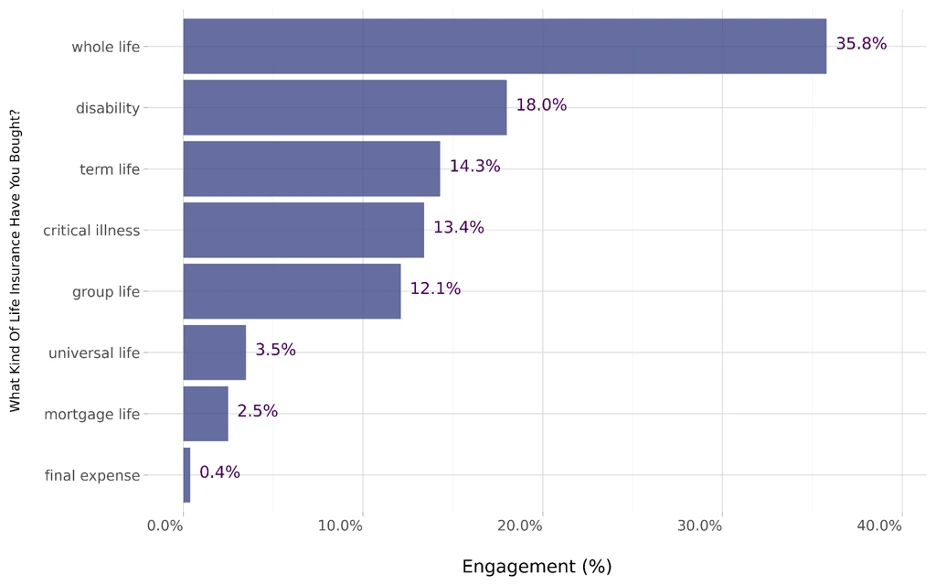 Figure 7: Types of life insurance purchased
- 35.8% - Whole life
- 18.0% - Disability
- 14.3% - Term life
- 13.4% - Critical illness
- 12.1% - Group life
- 3.5% - Universal life
- 2.5% - Mortgage life
- 0.4% - Final expense
How Much Does Your Life Insurance Policy Cover You For?
Just under 50% of Canadians surveyed are insured for $100,000.
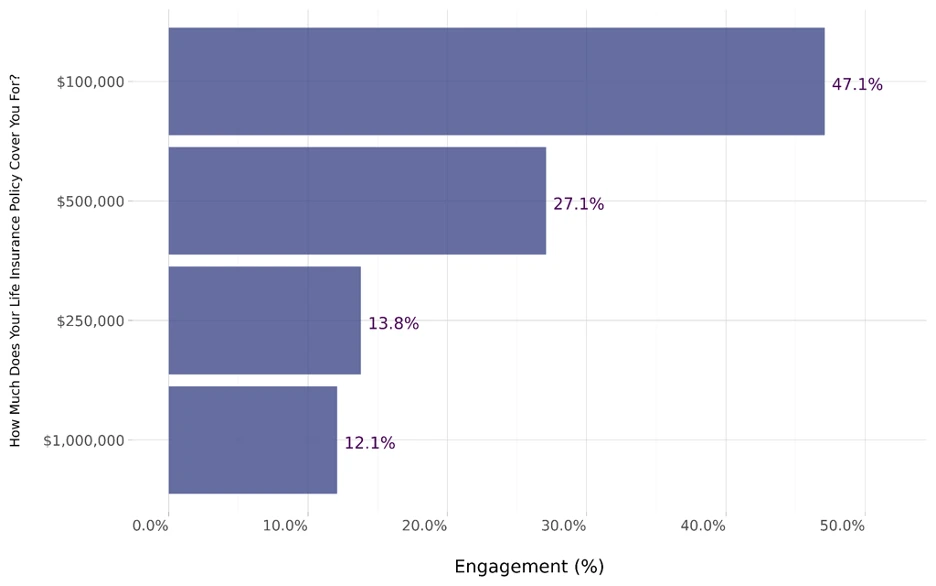 Figure 8: Life insurance coverage amounts
- 47.1% - $100,000
- 27.1% - $500,000
- 13.8% - $250,000
- 12.1% - $1 million
This helps explain why 2.4 million Canadians report being underinsured.
How Much Value for Money Is Your Life Insurance?
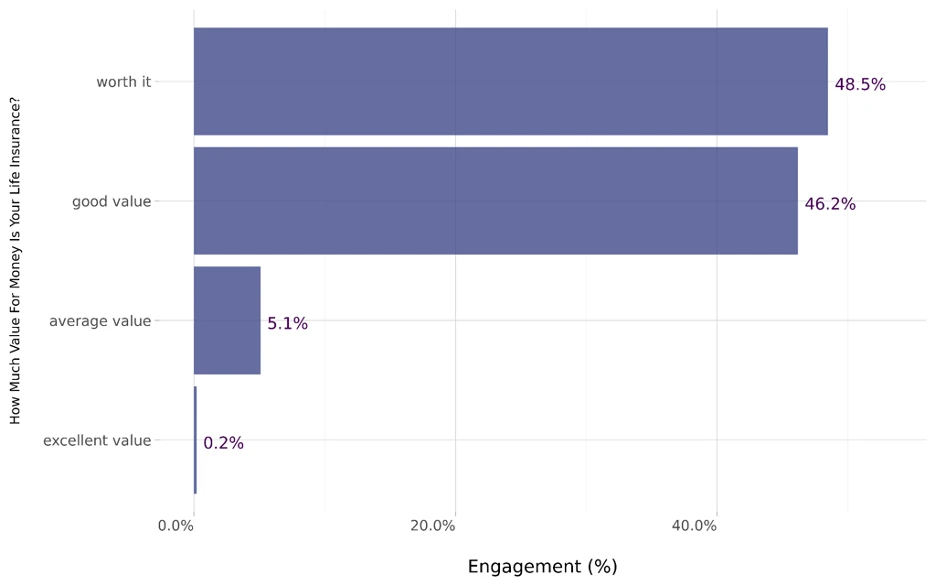 Figure 9: Perceived value for money of life insurance
- 48.5% - Agree their life insurance is worth it
- 46.2% - Say it's good value
- 5.1% - Average value
- 0.2% - Excellent value
Considering Canadian insurers paid out a record $128 billion in benefit claims in 2023, satisfaction levels are high.
How Would You Describe Your Knowledge Level on Life Insurance?
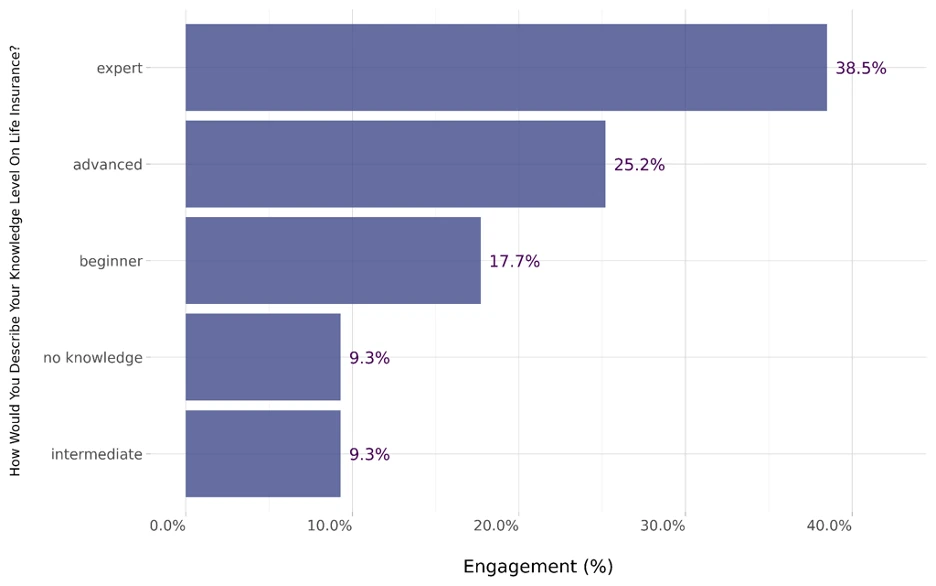 Figure 10: Self-reported knowledge levels on life insurance
- 38.5% - Expert
- 25.2% - Advanced
- 17.7% - Beginner
- 9.3% - No knowledge
- 9.3% - Intermediate
Canadian Life Insurance Demographics
Age Groups
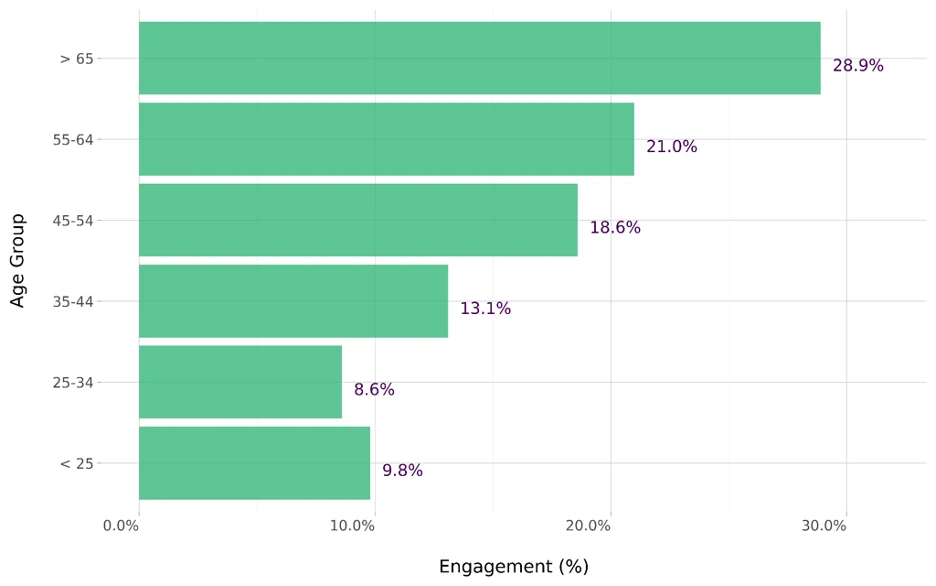 Figure 10: Survey Demographics - Age
- 65+ years: 28.9%
- 55-64 years: 21%
- 45-54 years: 18.6%
- 35-44 years: 13.1%
- Under 25 years: 9.8%
- 25-34 years: 8.6%
Sex
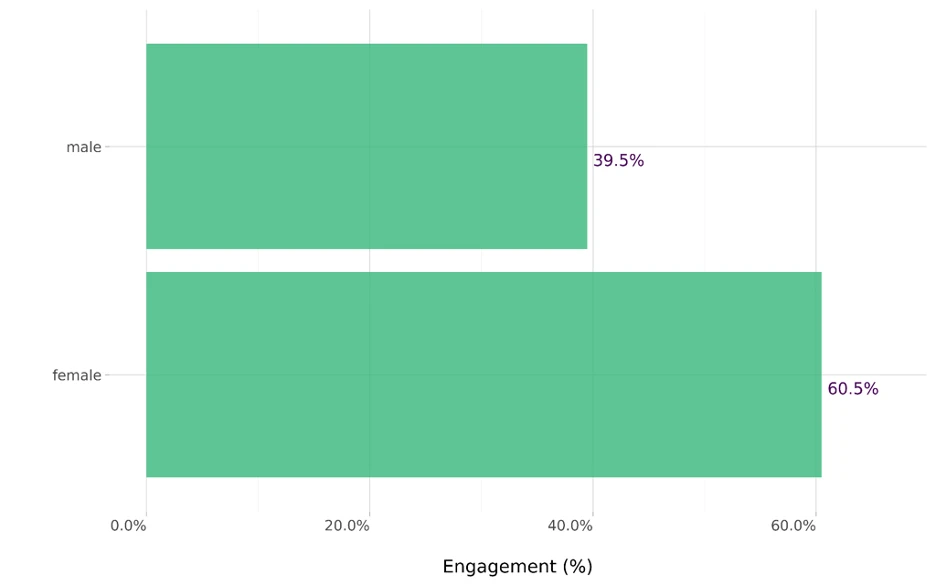 Figure 10: Survey Demographics - Sex
21% more women insured than men.
- 60.5% - Female
- 39.5% - Male
Province
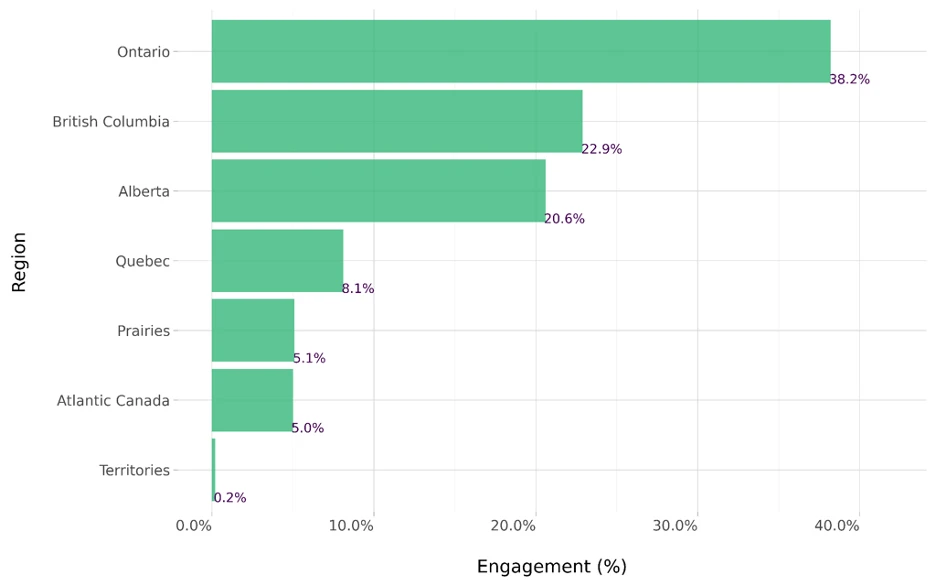 Figure 10: Survey Demographics - Province
- Ontario: 38.2%
- British Columbia: 22.9%
- Alberta: 20.6%
- Quebec: 8.1%
- Prairies: 5.1%
- Atlantic Canada: 5%
- Territories: 0.2%
Income Brackets
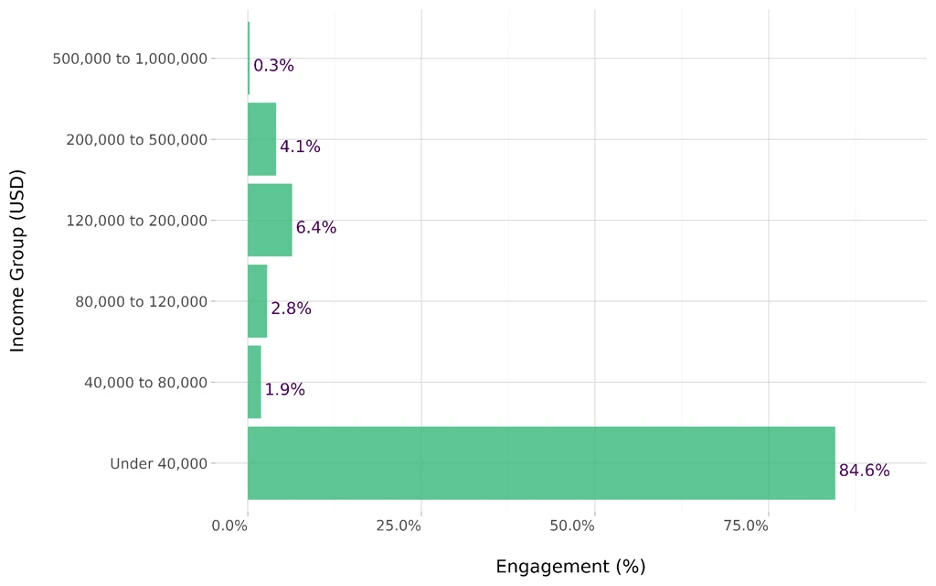 Figure 10: Survey Demographics - Income
Those earning under $40,000 make up over 80% of those with life insurance.
- <$40,000: 84.6%
- $120,000-$200,000: 6.4%
- $200,000-$500,000: 4.1%
- $80,000-$120,000: 2.8%
- $40,000-$80,000: 1.9%
- $500,000-$1M: 0.3%
Final Thoughts
Nearly a quarter of Canadians are concerned that they'll leave their dependents in financial difficulty if they die prematurely.
However, the data shows that many are taking positive steps to protect their families and that the life insurance market continues to grow.
About the Survey
The data used in this survey was sourced from an independent sample of 981,619 people in Canada on X, Quora, Reddit, TikTok, and Threads.
The responses were collected within a 95% confidence interval and 4% margin of error.
Demographics were determined using multiple signals (e.g., name, location, self-disclosed descriptions).
Privacy was preserved using k-anonymity and differential privacy.
Results are based on what people describe online - questions were not posed directly to participants.